
-
Deviation rates in food decay
I've been trying to work out the actual decay rates of food in hard numbers. I started testing on my creative single player world but my results kept coming up different when I would repeat a test. This lead me to trying to work out deviation rates - how random are decay rates. So I filled my hot bar with raw beef and skipped forward 48000 ticks (2 days) using /time add 48000. After each test I put new beef in my hot bar and repeated that 10 times.
Here is the chart I came up:
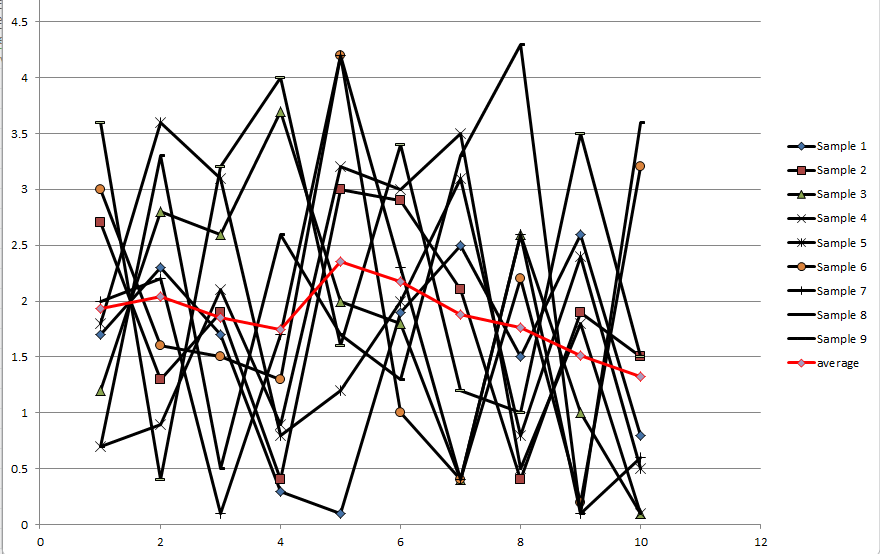
The y axis is the decay rate recorded. the x axis is the test batch number. The red line shows the average of each test. The total average decay for a piece of raw beef is 1.86 decay. The highest recorded decay rate was 4.3 decay. The lowest was .1 decay.
I was hoping that this would work out as a nice bell curve but when I organized the results by frequency within ranges I got this:
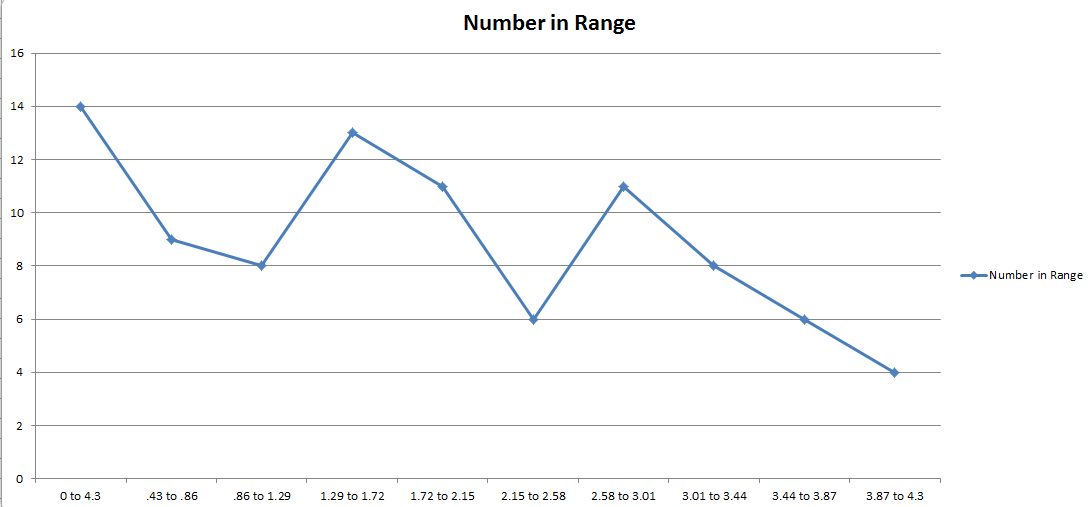
In other words there is no pattern to the distribution of decay rates. Decay rates don't tend to be anything. Instead all I can say about there being a pattern is that decay rates on a piece of raw beef over 48,000 ticks can be anything between .1 and 4.3.
 Posting Permissions
- You may not post new threads
- You may not post replies
- You may not post attachments
- You may not edit your posts
-
Forum Rules


 Reply With Quote

